Infographic: Gamat Emas
August 29, 2025
Malaysia Champions STI at APEC SOM3 in Incheon
September 18, 2025
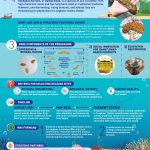
This study looks at how statistical control charts—tools normally used in manufacturing to check if a process is running smoothly—can be applied to monitor water quality. The researchers focused on a water treatment plant in Kota Kinabalu, Sabah, and tracked four key indicators of water quality: turbidity, pH, dissolved oxygen (DO), and iron concentration (Fe).
There are two main types of charts discussed:
- Univariate charts – look at one water quality variable at a time.
- Multivariate charts – look at several variables together, to see the bigger picture. Two popular ones tested here are the Hotelling’s T² chart and the MCUSUM chart.
The challenge is that these methods usually assume the data follow a normal distribution (bell-shaped curve). But in this study, tests showed that the water quality data did not follow normality, which makes the charts less reliable.
When the researchers plotted the data:
- The univariate charts sometimes flagged problems (like turbidity and iron going above safe levels), while pH and DO seemed stable.
- The multivariate charts (Hotelling’s T² and MCUSUM) also flagged issues, but not at the same points as the univariate charts.
- Interestingly, the MCUSUM chart became very sensitive after a certain point, giving repeated warnings, while Hotelling’s T² did not.
Because the two methods gave different results, the study concludes that relying only on these charts for water monitoring can be inconclusive when the data don’t fit normal assumptions. The authors recommend exploring non-parametric control charts (methods that don’t assume normal data) for more reliable monitoring.
Visit the ASM Science Journal to read in-depth from the article.